메모리 Leak 문제는 프로그램이 동적으로 할당한 메모리를 해제하지 않고 계속해서 사용하는 상태를 나타난다. 이로 인해 메모리 사용량이 계속 증가하며, 장기적으로는 시스템의 성능에 부정적인 영향을 미치게 된다. gperftools은 메모리 Leak을 체크하고 분석하는 데 사용되는 강력한 도구이다. 이 글에서는 gperftools를 이용하여 C++ 프로그램에서 메모리 누수를 체크하는 방법과 사용 예제에 대해 다룬다.
gperftools 란?
Google Performance Tools (gperftools)는 Google에서 개발한 성능 분석 도구의 모음 중 하나로, CPU 프로파일링, 메모리 누수 감지, 힙 프로파일링 등 다양한 성능 분석 기능을 제공한다. 여기서는 gperftools의 heap-checker와 heap-profiler를 중점적으로 살펴보도록 한다.
gperftools 설치
Ubuntu 기반 시스템에서는 다음 명령어로 gperftools을 설치할 수 있다.
우선 libtcmalloc.so 설치를 위해 libgoogle-perftools-dev 패키지를 설치한다.
$ sudo apt install libgoogle-perftools-dev그리고, callstack의 심볼을 얻기 위해 pprof를 포함하여 분석에 필요한 tool들을 설치하기 위해 google-perftools 패키지를 설치한다.
$ sudo apt install google-perftoolsheap-checker를 사용하여 메모리 누수 체크
기본 사용법
다음은 gperftools의 heap-checker를 사용하여 메모리 누수를 체크하기 위한 간단한 C++ 예제 코드이다.
// mem_leak_example.cpp
#include <iostream>
#include <cstdlib>

void leakyFunction() {
    int* ptr = new int;
    // 메모리를 할당했지만 해제하지 않음
    *ptr = 10;
    std::cout << *ptr ;
}

int main() {
    leakyFunction();
    return 0;
}
프로그램을 컴파일하고 실행한다.
$ g++ -g -o mem_leak_example mem_leak_example.cppheap-checker를 돌리기 위해 libtcmalloc.so와 google-pprof 경로를 미리 확인한다.
$ whereis google-pprof
google-pprof: /usr/bin/google-pprof /usr/share/man/man1/google-pprof.1.gz
$ whereis libtcmalloc.so
libtcmalloc.so: /usr/lib/x86_64-linux-gnu/libtcmalloc.so
확인 되었으면 아래와 같이 PPROF_PATH와 LD_PRELOAD로 각각 경로를 잡아주고 HEAPCHECK=normal로 heap-checker를 활성화하여 빌드한 바이너리를 실행한다.
$ PPROF_PATH=/usr/bin/google-pprof LD_PRELOAD=/usr/lib/x86_64-linux-gnu/libtcmalloc.so HEAPCHECK=normal ./mem_leak_example
WARNING: Perftools heap leak checker is active -- Performance may suffer
10Have memory regions w/o callers: might report false leaks
Leak check _main_ detected leaks of 4 bytes in 1 objects
The 1 largest leaks:
Using local file ./mem_leak_example.
Leak of 4 bytes in 1 objects allocated from:
        @ 5621d25401bf leakyFunction
        @ 5621d25401f4 main
        @ 7fbf2a666d90 __libc_start_call_main
        @ 7fbf2a666e40 call_init
        @ 5621d25400e5 _start


If the preceding stack traces are not enough to find the leaks, try running THIS shell command:

pprof ./mem_leak_example "/tmp/mem_leak_example.9600._main_-end.heap" --inuse_objects --lines --heapcheck  --edgefraction=1e-10 --nodefraction=1e-10 --gv

If you are still puzzled about why the leaks are there, try rerunning this program with HEAP_CHECK_TEST_POINTER_ALIGNMENT=1 and/or with HEAP_CHECK_MAX_POINTER_OFFSET=-1
If the leak report occurs in a small fraction of runs, try running with TCMALLOC_MAX_FREE_QUEUE_SIZE of few hundred MB or with TCMALLOC_RECLAIM_MEMORY=false, it might help find it
Exiting with error code (instead of crashing) because of whole-program memory leaksleak이 하나 detect 되었고, 위치는 leakyFunction으로 확인된다.
그래픽을 동반한 좀 더 자세한 정보를 알고자 하면 위에 출력된 pprof 명령 줄을 수행한다.
$ google-pprof ./mem_leak_example "/tmp/mem_leak_example.9600._main_-end.heap" --inuse_objects --lines --heapcheck --edgefraction=1e-10 --nodefraction=1e-10 --gv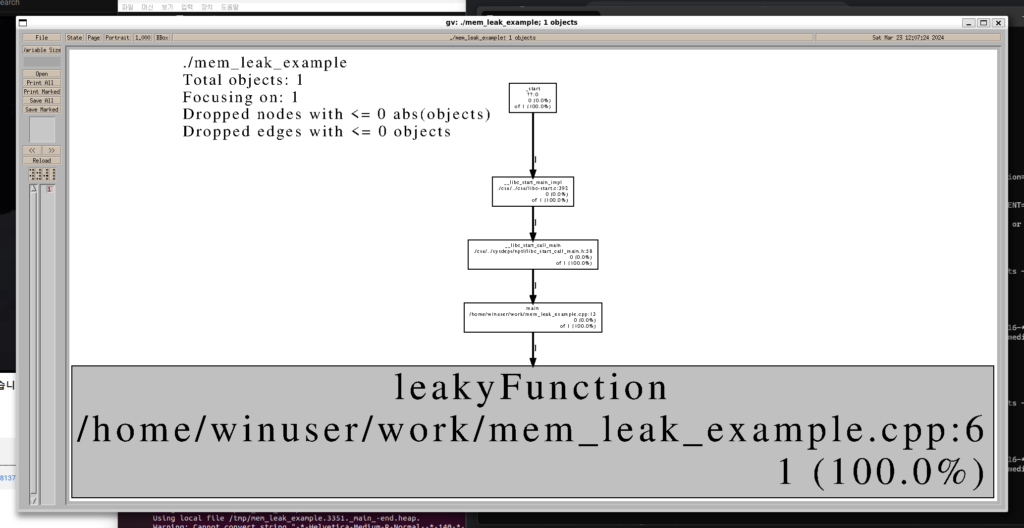
프로파일러 사용
heap-checker가 누수 여부와 대략적인 위치를 잡아준다면, heap-profiler는 프로그램 실행 중 특정 시점의 힙 스냅샷을 덤프해서 어떤 함수가 얼마나 많은 메모리를 물고 있는지 상세히 분석할 때 쓴다. 아래는 heap-profiler를 사용하는 예제이다.
// mem_profile_example.cpp
#include <iostream>
#include <cstdlib>
#include <gperftools/heap-profiler.h>

void profileFunction() {
    int* ptr = new int;
    // 메모리를 할당했지만 해제하지 않음
    *ptr = 10;
    std::cout << *ptr;
}

int main() {
    HeapProfilerStart("mem_profile_example");
    profileFunction();
    HeapProfilerDump("profile dump");
    HeapProfilerStop();
    return 0;
}heap-profiler.h의 API를 직접 호출하는 방식이라 libtcmalloc_and_profiler를 컴파일 시점에 바로 링크하면 되고, LD_PRELOAD는 필요 없다.
$ g++ -g -o mem_profile_example mem_profile_example.cpp -ltcmalloc_and_profiler
$ ./mem_profile_example
실행하면 HeapProfilerDump()를 호출한 시점 기준으로 mem_profile_example.0001.profile dump.heap 같은 이름의 힙 덤프 파일이 현재 디렉터리에 생성된다.
pprof로 힙 프로파일 결과 분석하기
생성된 힙 덤프는 pprof(또는 google-pprof)로 읽는다. --text 옵션을 주면 그래픽 도구 없이 터미널에서 바로 텍스트로 결과를 확인할 수 있다.
$ google-pprof --text mem_profile_example mem_profile_example.0001.profile\ dump.heapTotal: 0.0 MB
0.0 100.0% 100.0% 0.0 100.0% profileFunction
0.0 0.0% 100.0% 0.0 100.0% main
0.0 0.0% 100.0% 0.0 100.0% __libc_start_call_main각 열은 왼쪽부터 해당 함수에서 직접 할당된 메모리(MB), 전체 대비 비율, 누적 비율, 콜스택 하위 전체 누적 메모리, 누적 비율, 함수명 순서다. 실제 서비스 코드처럼 할당량이 큰 경우에는 이 목록 맨 위에 있는 함수부터 살펴보면 어디서 메모리를 가장 많이 물고 있는지 빠르게 좁힐 수 있다. 그래픽으로 콜그래프를 보고 싶다면 --gv 옵션으로 heap-checker 예제와 동일하게 시각화할 수 있다(graphviz, gv 패키지 필요).
마무리
gperftools를 활용하면 메모리 누수를 식별하고 프로그램의 성능을 향상시킬 수 있다. 메모리 누수는 프로그램의 안정성과 효율성에 부정적인 영향을 미칠 수 있으므로 주기적으로 체크하여 적절한 조치를 취하는 것이 좋다. heap-checker로 빠르게 누수 여부와 대략적인 위치를 확인하고, heap-profiler와 pprof로 정확히 어떤 함수가 메모리를 물고 있는지 분석하는 흐름으로 접근하면 된다.
참고 사이트
- gperftools – Google Performance Tools:
gperftools의 공식 GitHub 페이지 - gperftools – Google Open Source: Google에서 제공하는 오픈소스 프로젝트 페이지
- https://goog-perftools.sourceforge.net/doc/heap_profiler.html